
Crude Oil:

/CL has formed a weekly bullish engulfing. Expect a move higher in the coming weeks. Weekly engulfings are backtested to be effective for crude oil.
Gold:

/GC formed a double bottom after a bull flag break out.
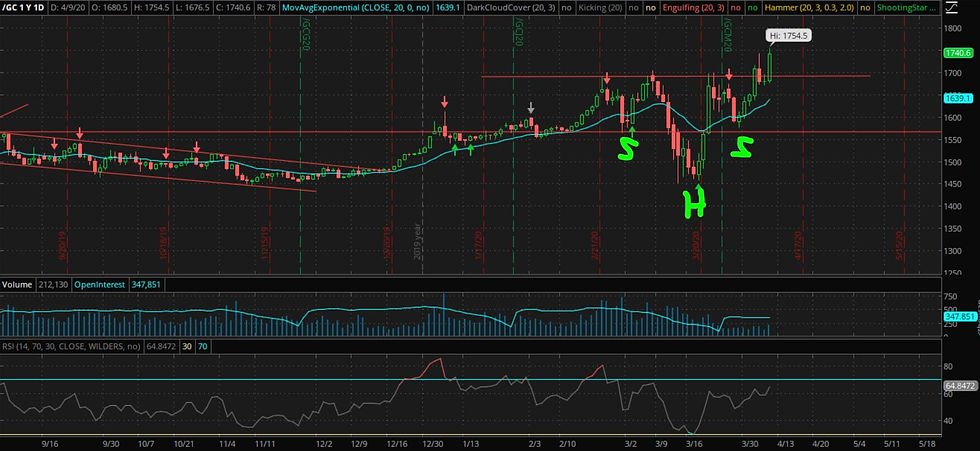
/GC formed an inverse head-and-shoulders formation with a breakout above the neckline. Expect this to go higher in the coming months. Very bullish.
Biotech Sector:

Bounced at the same level from 2018 low. Bear flag is forming. Watch for the coming resistance levels. Oil&Gas Exploration Sector:

RSI divergence has formed in the short-term.

Be very careful because this sector is in a strong long-term downtrend. It has been very oversold in the weekly chart, a further move down to a new low will form a weekly RSI divergence.
Semiconductors Sector:

The trend is parabolic. Had a false break out from a rising wedge.

Double top has formed before the crash and a bear flag is forming. It's back to the breakout point from the rising wedge.
Watch if it gets rejected as a further move down is very likely. Lots of bearish reversal patterns.
Natural Gas:

/NG looking to have found support at the same level as 2016.

/NG looks to be respecting the old channel down as support. RSI divergence and a double bottom has formed in the daily chart. Good chance of start of a reversal to the upside.
US Dollar:

It appears to have been rejected at a previous top. Potential double top formation.

However, a weekly bullish engulfing has formed from a few weeks ago.

$DXY has been very choppy and volatile the past few weeks. It's been going in and out of the old uptrend channel. Coming from a double top and a how a lower high has been made, I'm leaning towards a bearish movement in the coming months.
Expecting big movements in the coming months.
Have fun!
Comments